


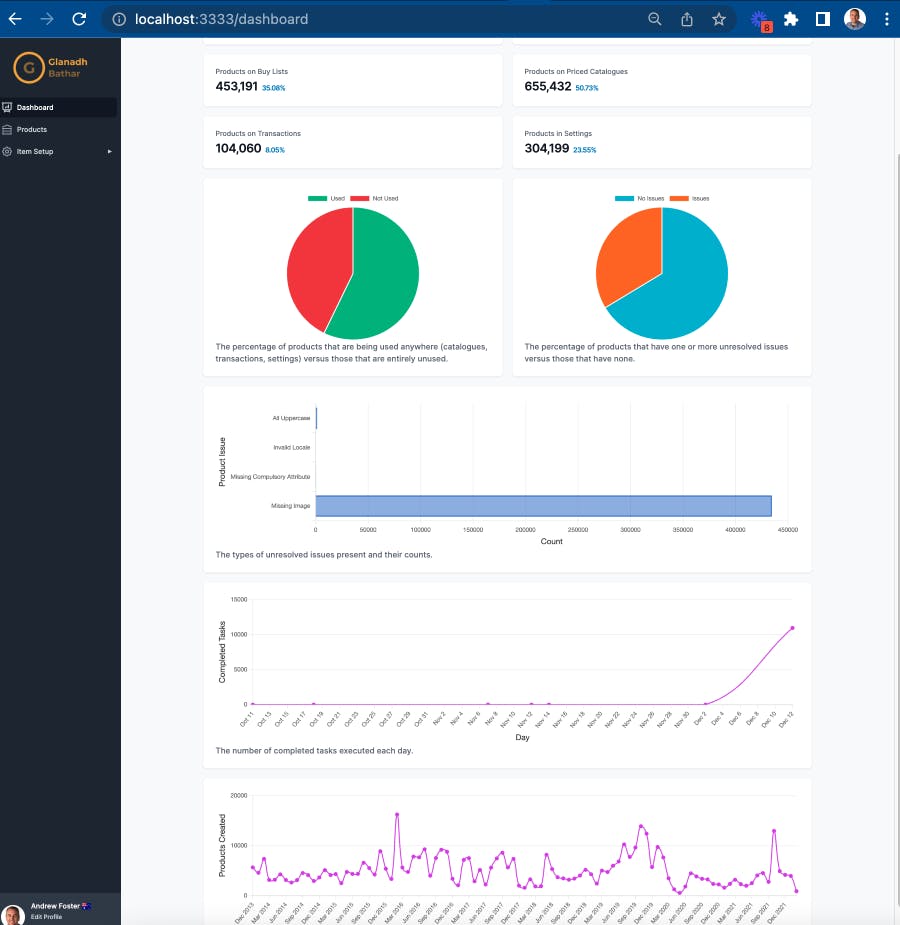
A key part of a business application in my opinion is providing the users with a quick, easily understandable overview of what is happening in that application. In my case, I want to provide some statistics about the data and some gentle nudges about what requires user attention.
This is what I am aiming for:
Fortunately, some existing graphing gems will make this a relatively straightforward job. The gem I have chosen is called "chartkick" as it has helper methods for producing all the charts I need to display.
To install it I can add the gem to the Gemfile:
Gemfile
gem 'chartkick'
Since I am using esbuild I need to install the JavaScript package using the following command:
yarn add chartkick chart.js
And finally, import the library:
app/javascript/application.js
// Entry point for the build script in your package.json
import "@hotwired/turbo-rails"
import "./controllers"
import "../components"
import "chartkick/chart.js"
Now I can start adding charts to the dashboard. chartkick allows individual charts to be loaded asynchronously so the user is not waiting for everything to be generated before they see the page appear, so I'll take advantage of that.
As an example, I'll show the process for the "Used" vs "Not Used" pie chart. Retrieving the count of "used" products is not a straightforward query so it makes sense to build that as a Query Object:
app/models/queries/product_usage_counts.rb
module Queries
  class ProductUsageCounts < Base
    module Scopes
      def having_product_id(product_id: nil)
        return all if product_id.nil?

        where(id: product_id)
      end

      def having_non_zero_count(coalesced_attributes:, only_non_zero: false)
        return all unless only_non_zero

        where("(#{coalesced_attributes.join(' + ')}) > 0")
      end
    end

    def initialize(scope:)
      super
      @scope = scope || Product.all
    end

    def call(options: {})
      @scope
        .extend(Scopes)
        .select("#{coalesced_attributes(attributes: options[:attributes]).join(' + ')} AS usage_count")
        .having_product_id(product_id: options[:product_id])
        .having_non_zero_count(
          coalesced_attributes: coalesced_attributes(attributes: options[:attributes]),
          only_non_zero: options[:only_non_zero]
        )
    end

    private

    def coalesced_attributes(attributes:)
      attributes.map do |a|
        "COALESCE(#{a}, 0)"
      end
    end

    def usage_attributes
      []
    end
  end
end
This query object has various options that can be provided depending on how I want to calculate the count and whether I want to know the count for one product or all products (as is the case for this chart).
Here's how I'm calling it:
app/models/dashboard.rb
class Dashboard
  def number_of_products_used
    @number_of_products_used ||=
      Queries::ProductUsageCounts
      .call(options:
          {
            attributes: Product.catalogue_usage_attributes |
              Product.transaction_usage_attributes |
              Product.settings_usage_attributes,
            only_non_zero: true
          }
           )
      .size
  end
end
I've created a new class called Dashboard that will hold all the methods I'll need for the data on the dashboard.
In the dashboard controller, I'll create an instance of this Dashboard and expose it to the index view using a helper method:
app/controllers/dashboard_controller.rb
class DashboardController < ApplicationController
  include Authenticated

  helper_method :dashboard

  def percentage_products_used_vs_not_used
    render(json:
      {
        t('.labels.used') => dashboard.percentage_products_used,
        t('.labels.not_used') => dashboard.percentage_products_not_used
      }
          )
  end
end
Because I want this chart to be asynchronous I'm using this via its own endpoint. The routing table needs to know about this as well:
config/routes.rb
Rails.application.routes.draw do
  # Dashboard
  get '/dashboard' => 'dashboard#index'
  get '/dashboard/percentage_products_used_vs_not_used' => 'dashboard#percentage_products_used_vs_not_used'
end
Lastly, the view can render the chart using the pie_chart helper:
app/views/dashboard/index.html.erb
<div id="dashboard" class="mt-5 grid grid-cols-1 gap-5 sm:grid-cols-2 bg-gray-50">
  <div id="dashboard_products_used_vs_not_used" class="overflow-hidden rounded-lg bg-white px-4 py-5 shadow sm:p-6">
    <%= pie_chart(dashboard_percentage_products_used_vs_not_used_path, id: 'dashboard_products_used_vs_not_used--chart', colors: %w[#10b981 #ef4444]) %>
    <p id="dashboard_products_used_vs_not_used--label" class="font-medium text-gray-500">
      <%= t('.labels.percentage_products_used_vs_not_used.title') %>
    </p>
  </div>
</div>
And that's it! The rest of the charts and graphs will follow a separate pattern. The information boxes that show a number and a percentage are using TailwindUI components backed by the Dashboard class as well.